
Weather news

So was it a cold April?
A review of the weather of April 2024
T.S. Eliot wrote that “April is the cruellest month”. He was writing about the impact of increasing daylight and burgeoning spring growth on someone who is depressed, but many have applied it to the vagaries of the weather in April. Everybody seems to think that April 2024 has been cold and unpleasant, but is this true?
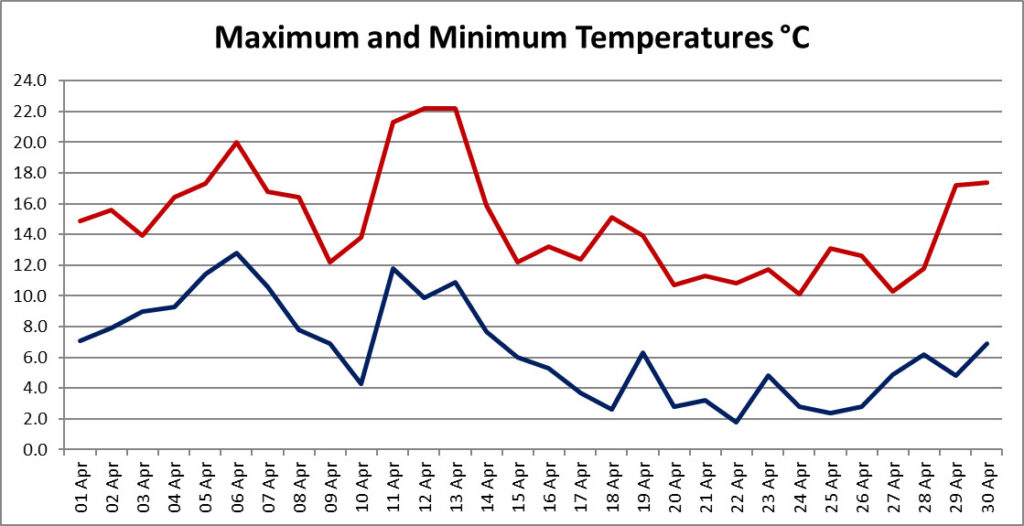
Well, in fact April 2024 was, perhaps surprisingly, warmer than the long term average. The mean temperature for the month was 10.0°C, almost a full degree above the long term average of 9.1°C. Highest for the month was 22.2°C on 12th and 13th, which is higher than the max in all but ten of our 40 years of records. The lowest was 1.8°C on 22nd, and only three Aprils in our records had higher monthly minima, and this was the 16th April in 40 years not to record an air frost.
So why do we think it was so cold? Perhaps because the cold weather came in the second half of the month. Thus the average day maximum for the 1st to the 15th was a pleasant 16.7°C, whereas for the 16th to 30th it was a rather more chilly 12.8°C.
As far as rain goes, it was – surprise, surprise – another wet month. The total of 78.4mm was 55% more than the average of 50.6mm, and it was our seventh wettest April. That now makes it an astonishing eight months in a row now that the weather has been both warmer and wetter than the long term average. Wettest day was the 28th with 22.6mm, our fourth wettest April day. It rained on 16 days, just over the long term average of 14.6 days.

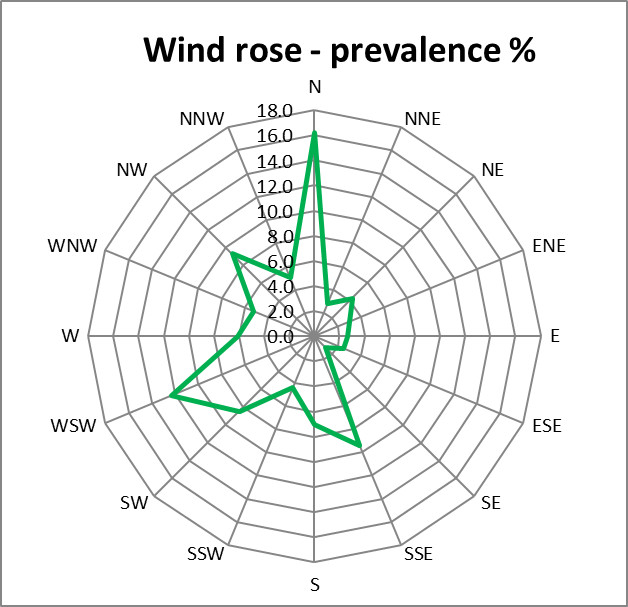
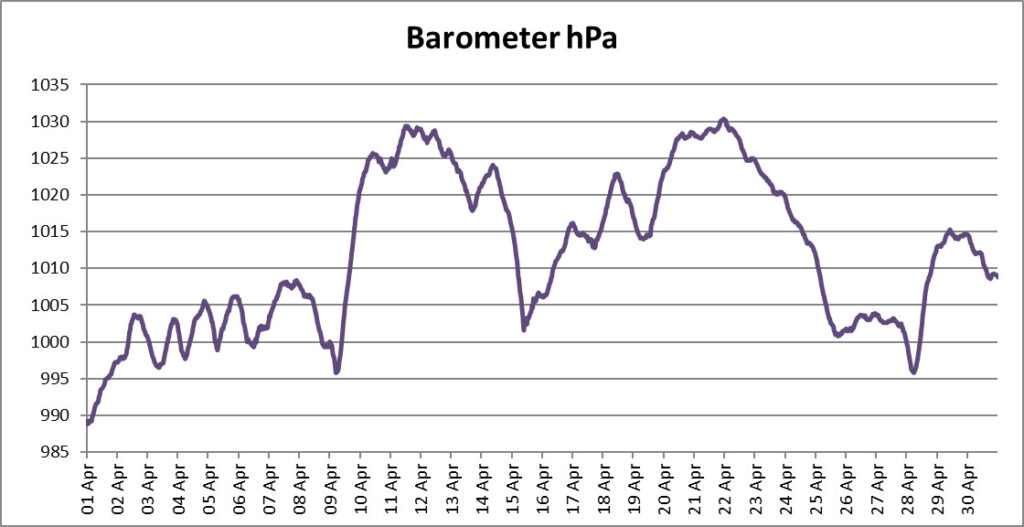
The chilly end to the month was due to a static high pressure system feeding persistent and often brisk north or north-westerly winds across the country. The strongest wind of the month was 37mph (Force 7) from the NNW on 15th.

There were two named storms in April: Storm Kathleen passed by on 6th-7th April, but its impact on Epping was not great; with Storm Lilian at the end of the month however, whilst the worst of its winds didn’t reach Epping, it brought more than half the month’s rain on 27th and 28th, as the weather transitioned from cold to quite a bit warmer.
So can we really get nine months in a row of warmer and wetter Epping weather than average? Take a look here once May has finished to find out!
Want to get email notification of weather news? Sign up here
Here is a list of Weather News articles.
- A long hot dry summer – a review of the weather of Meteorological Summer 2026
- The heat and drought go on – a summary of the weather of August 2026
- An astonishing month of heat and drought records – a summary of the weather of July 2026
- Temperature records broken for the second month in a row – a review of the weather of June 2026
- We need your photos!
- Warmest Spring on record
- Heat records smashed – a summary of the weather of May 2026
- More records tumble, some not even in April – a review of the weather of April 2026
- Turned out nice again – a review of the weather of March 2026
- That’s why they call it February fill-dyke – a review of the weather of February 2026
- A wet start to the year – a review of the weather of January 2026
- It keeps getting warmer – a summary of the weather of 2025
- More records broken – a review of the weather of December 2025
- A month of ups and downs – a review of the weather of November 2025
- Bookended by storms – a review of the weather of October 2025
- At last a normal month – a review of the weather of September 2025
- Two storms and a heatwave – a summary of the weather of August 2025
- A third heatwave but some rain at last – a review of the weather of July 2025
- More heat records – a review of the weather of June 2025
- May rounds off a warm, dry Spring – a review of the weather of May 2025
- Wall to wall sunshine (almost) – a review of the weather of April 2025
- Lambs all the way – a review of the weather of March 2025
- A quiet February – a review of the weather of February 2025
- Cold snaps and storms – a review of the weather of January 2025
- It’s still getting warmer – a review of the year’s weather in 2024
- It was a grey Christmas – a review of the weather of December 2024
- A first taste of Winter – a summary of the weather of November 2024
- And still it’s mild – a review of the weather of October 2024
- Still wet and still warm (just) – a review of the weather of September 2024
- A proper month of Summer – a review of the weather of August 2024
- Summer returns! A review of the weather of July 2024
- At last it’s stopped raining! – a review of the weather of June 2024
- Clear evidence of climate warming – a summary of the weather of May 2024
- So was it a cold April? A review of the weather of April 2024
- And still it’s mild and wet… a review of the weather of March 2024
- Records tumble as it stays wet and mild – a review of the weather of February 2024
- Storms and ice – a review of the weather of January 2024
- Another warmer and wetter year – a review of the year’s weather in 2023
- A soggy end to a soggy year – a review of the weather of December 2023
- The wet Autumn continues – a review of the weather of November 2023
- Storm Babet lets us off lightly – a review of the weather of October 2023
- Records tumble in sultry September – a review of the weather of September 2023
- A thoroughly average August – a review of the weather of August 2023
- Wet and cool – or was it? A review of the weather of July 2023
- Flaming June – more records go – a review of the weather of June 2023
- Plenty of settled weather – a review of May 2023
- An unremarkable month – a review of the weather of April 2023
- Squelching into Spring – a review of the weather in March 2023
- Dry February – a review of the weather of February 2023
- A month of split personality – a review of the weather of January 2023
- Another record-breaking year – a review of the weather of 2022
- Three seasons in a month – a review of the weather of December 2022
- Snow report
- Wet and mild – a review of November 2022
- At last we’re back!
- Back to (almost) normal – a review of the weather of September 2022
- More crazy record-breaking weather!
- Records tumble as desert like conditions prevail – a review of July 2022
- Heatwave newsflash – new record temperature for Epping
- The warm and dry theme continues – a review of June 2022
- The dry spell continues – a review of May 2022
- April Showers dry up again – a review of April 2022
- More like a lamb than a lion – a review of March 2022
- A notably stormy month – a review of February 2022
- A year of calm – a review of the weather of 2021
- The New Year slips quietly in – a review of January 2022
- Fifty shades of grey – a review of December 2021
- Autumn quietly peters out – a review of November 2021
- Still warm and wet as the evenings draw in
- An afterglow of Summer
- Autumn comes early
- And another wet month!
- June 2021 was a month of two halves
- Our weather is still lurching between extremes!
- April Showers dry up
- Some Mad March Days but also record temperatures
- Winter and Spring in a couple of weeks
- The north wind doth blow, and we shall have snow
- A review of the weather in Epping in 2020
- Wet and gloomy sums it up
- A mild but otherwise average November
- Wet wet wet – weather review of October 2020
- Another heat record broken in September
- August had some of everything except snow
- A traditional English summer
- Not much Blazing in changeable June
- Wall to wall sunshine for lockdown May
- It’s April, so where are the showers?
- March comes in like a lion, goes out like a lamb
- February Fill-dyke
- The warmest January in Epping records!
| Measure | Unit | Minimum | Average | Maximum | Average min | Average max | Total |
|---|---|---|---|---|---|---|---|
| Relative humidity | % | 42 | 76 | 94 | |||
| Temperature | °C | 1.8 | 10.0 | 22.2 | 6.5 | 14.8 | |
| Wind source (most common/highest gust) | Sector | N | NNW | ||||
| Wind speed | mph | 4.2 | 37 | 21.1 | |||
| Rain daily accumulation | mm | 2.6 | 22.6 | 78.4 | |||
| Barometric pressure | hPa | 988.8 | 1012.1 | 1030.4 | |||
| Solar irradiance during daylight | W/m² | 241 | 1102 | 828 | |||
| Sunshine (sunny if irradiance > 120 W/m2) | Hours | 9.4 | 11.5 | 281.5 |