
Weather news
More records broken
A review of the weather of December 2025
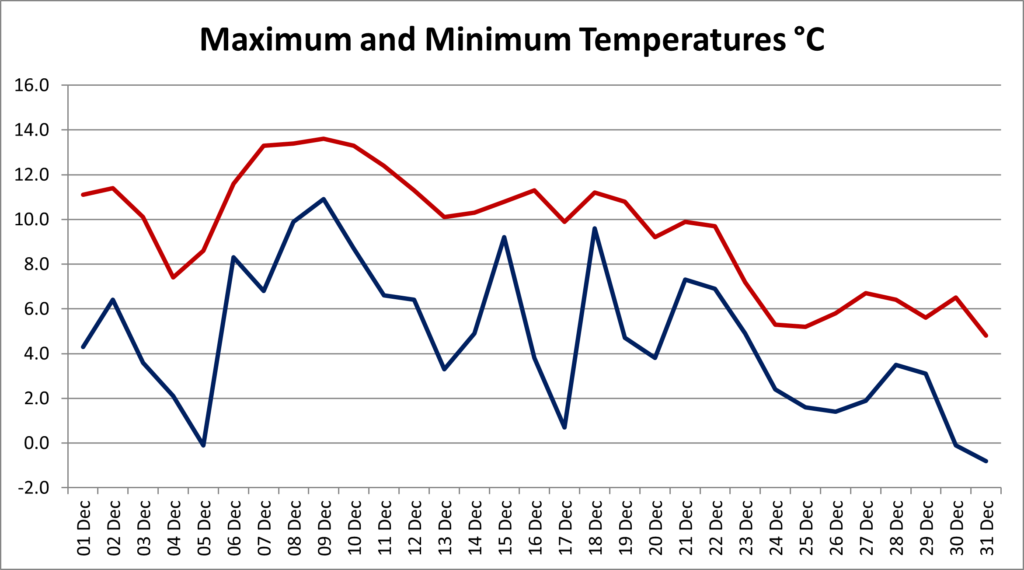
Met Office data shows that December 2025 was generally a warmer and drier month than average for our region, and that is borne out by our records. The mean temperature for the month was 7.1°C – not just the third warmest in our 41 years of records but actually equal to the average daily maximum temperature for 1979-2013! And the average daily maximum for this December equalled our record high of 9.5°C set just two years ago. Top temperature for the month came on the 9th at 13.6°C, our sixth warmest December day. It was also our fifth warmest average daily minimum at 4.7°C. Despite this we still experienced three frosts.
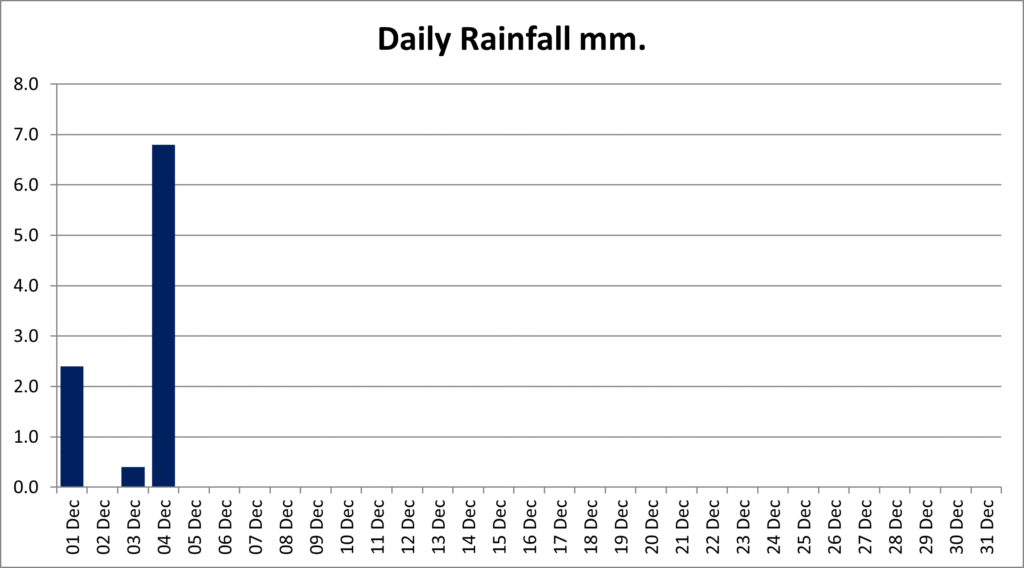
It was certainly dry in Epping in December! It rained on just 3 days, a record low for December, and only May 1990 and April 2011 have had fewer days with two each. The month’s total was only 9.6mm, also a record December low for us. It didn’t rain after the 4th, a run of 27 dry days and counting. Just to note, our record dry spell is 30 days…
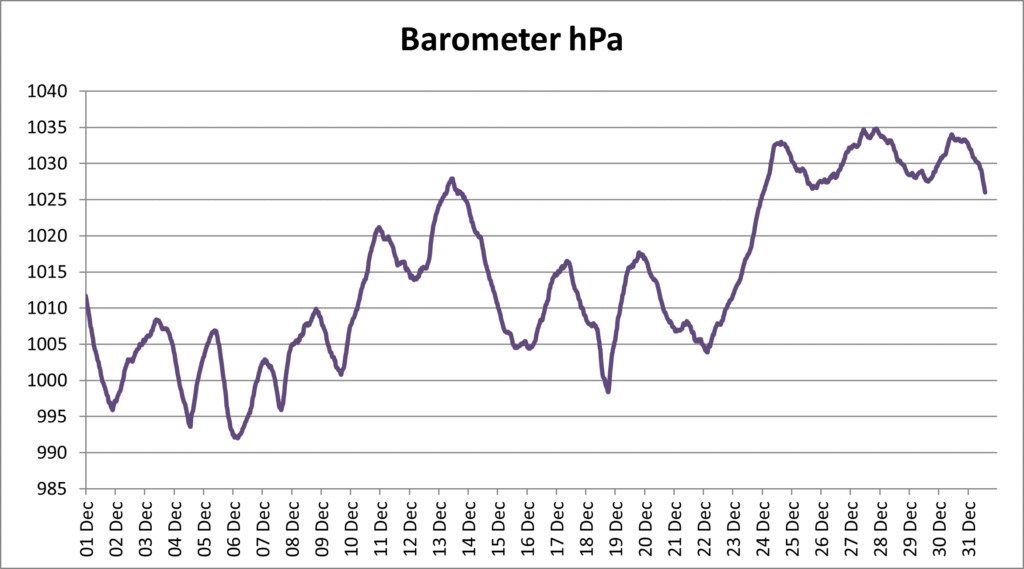
Storm Bram passed through on 9th-10th December but although there were major impacts in Scotland, the effects were barely felt in Epping, with the pressure record showing it was just another depression during a generally unsettled – if largely dry – first three weeks of the month; the pressure then started to build into the new year. Overall the mean monthly pressure was 1014.3 mb, slightly above the long term average for December of 1013.0 mb. The lowest pressure of the month, 992.0 mb, was our fourth highest minimum for December.
The winds weren’t anything special for December. The highest wind of the month was 33 mph (Force 7) from the SSE on the 5th, the long term average being 37.7 mph.


And finally, it might not have felt like it, but the sun did actually come out in December. We’ve only two years of comparable records, but this December was almost twice as sunny as last December, with 31.4 hours over 16 days of the month, and the sunniest day was Christmas Day! Admittedly that also means half the days of the month were wall to wall cloud…
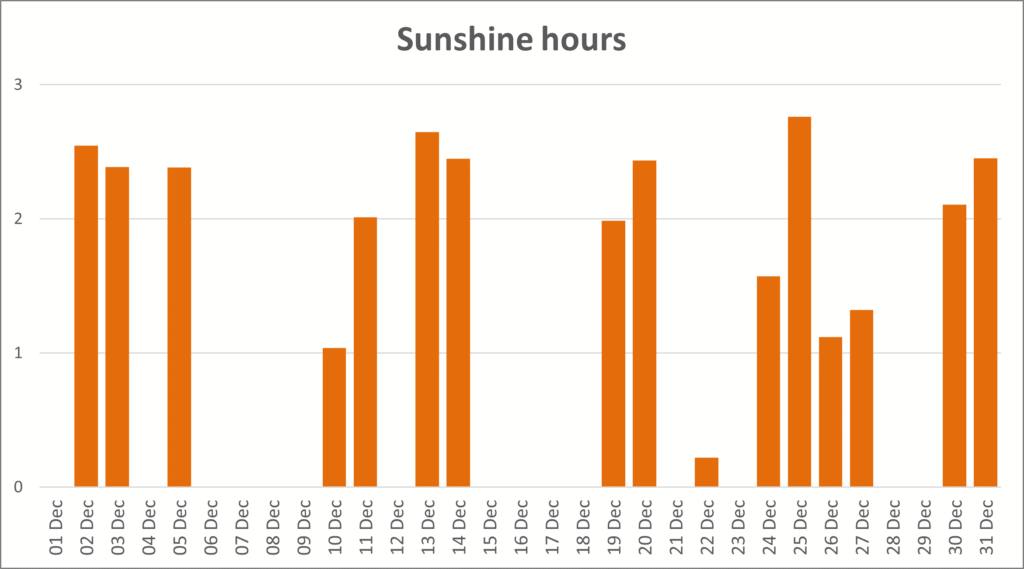
So with January starting off with a freeze, will it mean that this January bucks the trend of warmer than average months?
The 2025 year summary will be published on this site shortly.
Want to get email notification of weather news? Sign up here
Here is a list of Weather News articles.
- 37 months and counting – a review of the weather of September 2026
- A long hot dry summer – a review of the weather of Meteorological Summer 2026
- The heat and drought go on – a summary of the weather of August 2026
- An astonishing month of heat and drought records – a summary of the weather of July 2026
- Temperature records broken for the second month in a row – a review of the weather of June 2026
- We need your photos!
- Warmest Spring on record
- Heat records smashed – a summary of the weather of May 2026
- More records tumble, some not even in April – a review of the weather of April 2026
- Turned out nice again – a review of the weather of March 2026
- That’s why they call it February fill-dyke – a review of the weather of February 2026
- A wet start to the year – a review of the weather of January 2026
- It keeps getting warmer – a summary of the weather of 2025
- More records broken – a review of the weather of December 2025
- A month of ups and downs – a review of the weather of November 2025
- Bookended by storms – a review of the weather of October 2025
- At last a normal month – a review of the weather of September 2025
- Two storms and a heatwave – a summary of the weather of August 2025
- A third heatwave but some rain at last – a review of the weather of July 2025
- More heat records – a review of the weather of June 2025
- May rounds off a warm, dry Spring – a review of the weather of May 2025
- Wall to wall sunshine (almost) – a review of the weather of April 2025
- Lambs all the way – a review of the weather of March 2025
- A quiet February – a review of the weather of February 2025
- Cold snaps and storms – a review of the weather of January 2025
- It’s still getting warmer – a review of the year’s weather in 2024
- It was a grey Christmas – a review of the weather of December 2024
- A first taste of Winter – a summary of the weather of November 2024
- And still it’s mild – a review of the weather of October 2024
- Still wet and still warm (just) – a review of the weather of September 2024
- A proper month of Summer – a review of the weather of August 2024
- Summer returns! A review of the weather of July 2024
- At last it’s stopped raining! – a review of the weather of June 2024
- Clear evidence of climate warming – a summary of the weather of May 2024
- So was it a cold April? A review of the weather of April 2024
- And still it’s mild and wet… a review of the weather of March 2024
- Records tumble as it stays wet and mild – a review of the weather of February 2024
- Storms and ice – a review of the weather of January 2024
- Another warmer and wetter year – a review of the year’s weather in 2023
- A soggy end to a soggy year – a review of the weather of December 2023
- The wet Autumn continues – a review of the weather of November 2023
- Storm Babet lets us off lightly – a review of the weather of October 2023
- Records tumble in sultry September – a review of the weather of September 2023
- A thoroughly average August – a review of the weather of August 2023
- Wet and cool – or was it? A review of the weather of July 2023
- Flaming June – more records go – a review of the weather of June 2023
- Plenty of settled weather – a review of May 2023
- An unremarkable month – a review of the weather of April 2023
- Squelching into Spring – a review of the weather in March 2023
- Dry February – a review of the weather of February 2023
- A month of split personality – a review of the weather of January 2023
- Another record-breaking year – a review of the weather of 2022
- Three seasons in a month – a review of the weather of December 2022
- Snow report
- Wet and mild – a review of November 2022
- At last we’re back!
- Back to (almost) normal – a review of the weather of September 2022
- More crazy record-breaking weather!
- Records tumble as desert like conditions prevail – a review of July 2022
- Heatwave newsflash – new record temperature for Epping
- The warm and dry theme continues – a review of June 2022
- The dry spell continues – a review of May 2022
- April Showers dry up again – a review of April 2022
- More like a lamb than a lion – a review of March 2022
- A notably stormy month – a review of February 2022
- A year of calm – a review of the weather of 2021
- The New Year slips quietly in – a review of January 2022
- Fifty shades of grey – a review of December 2021
- Autumn quietly peters out – a review of November 2021
- Still warm and wet as the evenings draw in
- An afterglow of Summer
- Autumn comes early
- And another wet month!
- June 2021 was a month of two halves
- Our weather is still lurching between extremes!
- April Showers dry up
- Some Mad March Days but also record temperatures
- Winter and Spring in a couple of weeks
- The north wind doth blow, and we shall have snow
- A review of the weather in Epping in 2020
- Wet and gloomy sums it up
- A mild but otherwise average November
- Wet wet wet – weather review of October 2020
- Another heat record broken in September
- August had some of everything except snow
- A traditional English summer
- Not much Blazing in changeable June
- Wall to wall sunshine for lockdown May
- It’s April, so where are the showers?
- March comes in like a lion, goes out like a lamb
- February Fill-dyke
- The warmest January in Epping records!
| Measure | Unit | Minimum | Average | Maximum | Average min | Average max | Total |
|---|---|---|---|---|---|---|---|
| Relative humidity | % | 61 | 88 | 96 | |||
| Temperature | °C | -0.8 | 7.1 | 13.6 | 4.7 | 9.5 | |
| Wind source (most common/highest gust) | Sector | S | SSE | ||||
| Wind speed | mph | 3.7 | 33 | 18.8 | |||
| Rain daily accumulation | mm | 0.3 | 6.8 | 9.6 | |||
| Barometric pressure | hPa | 992 | 1014.3 | 1034.8 | |||
| Solar irradiance during daylight | W/m² kWh/m² | 60 | 334 | 175 | 14.8 |
||
| Sunshine (according to University of California formula) | Hours | 1.0 | 2.8 | 31.4 |
Thanks Roger…..and a Happy New Year to you and your good wife. …Graham Foy
Another excellant report.
Excuse my ignorance….what can we learn ,and use, from the data covered by Barometre pressure figures ?
Hope Sherringham is still a virbrant town and district…..If all goes according to to plan me and my older siblings intend booking a week , four bed house, in September.
Graham