
Weather news

Cold snaps and storms
A review of the weather of January 2025
Our January weather was arguably dominated by the cold spell which lasted much of the first two weeks of the month. This spell was enough to end the run of 16 consecutive months of temperatures above the long term average, giving this January an overall mean temperature of 3.6°C, which is 0.6°C below the average.

There was little snow, but there were nine days with a frost, and one “ice day” (where the temperature never rises above zero) on the 10th when the maximum for the day was -0.2°C. That makes this the 13th January in our 41 years of records to have an ice day.
Lowest for the month was -4.6°C on the 12th, which was 0.6°C colder than the average January minimum but not exceptional. The maximum for the month was 11.7°C on New Year’s Day, before the chill set in; that was a whisker above the long term average maximum for January.
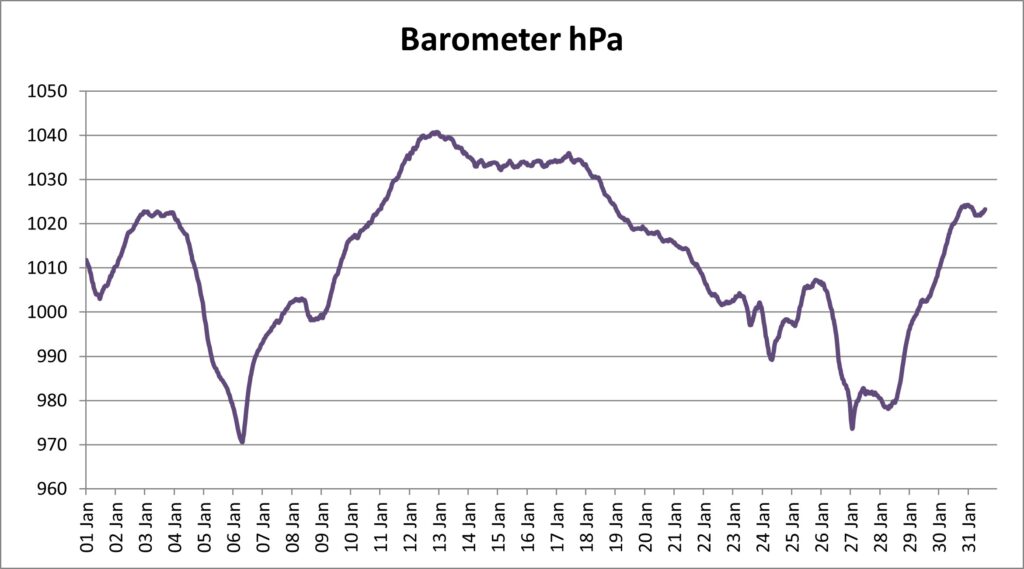
The main (and only named) storm for the country as a whole was Storm Eowyn, which caused considerable damage to the west and north of the British Isles but had relatively much less impact in Epping. Our main storms were a depression that moved through on 6th January, and another following Eowyn on the 27th to 29th. The first gave us our lowest pressure of the month, 970.6 hPa (or millibars if you prefer), the second lowest pressure in our 17 years of comparable records, and also our wettest day on the 5th, with 25.4mm – exactly an inch of rain, which equalled the total for our wettest January day on record in 1982. Unsurprisingly the deluge resulted in some localised flooding in the area.
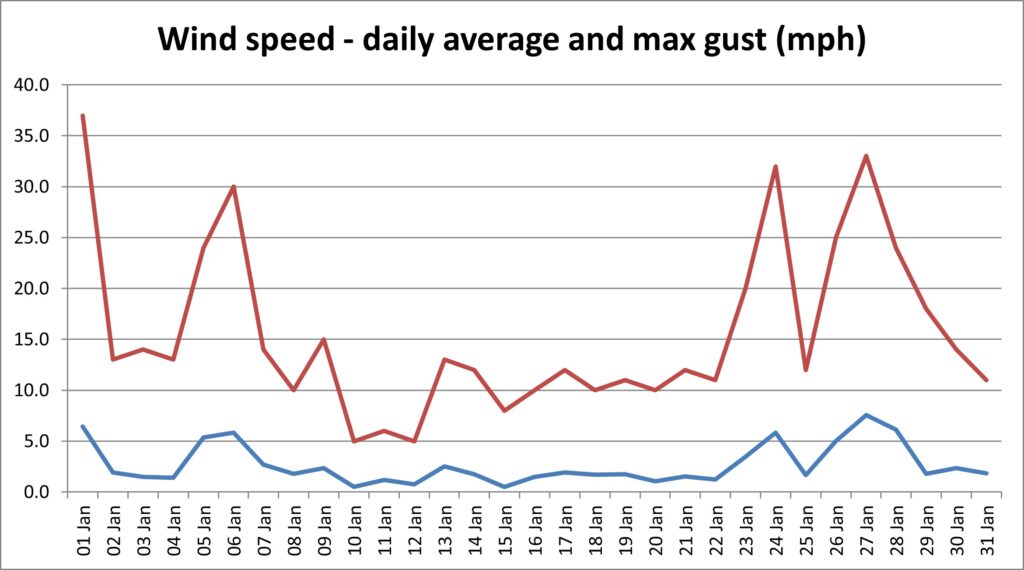
The strongest winds of the month however came also on New Year’s Day, courtesy of a deep depression at the tail end of the old year which had a sting in its tail. Top wind gust was 37mph, or Force 7.

Overall, January totalled 71.6mm of rain, which was just over 10mm more than the long term average. That this fell on 14 days in the month, rather less than the long term average of 18.6 days, indicated that when it rained, it rained hard.

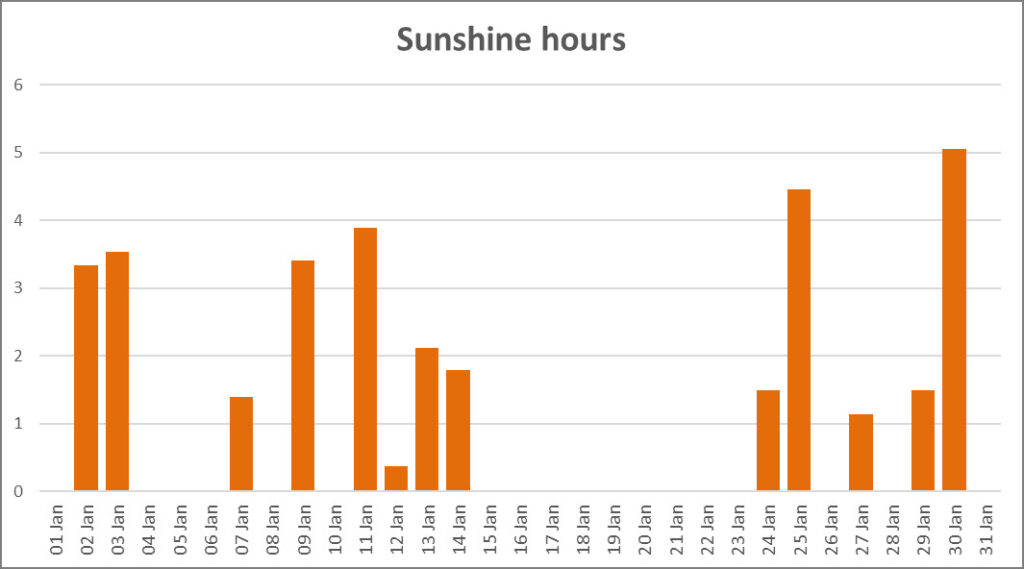
Finally to the sunshine records. Only 33.5 hours of sunshine was recorded across the month, which included no less than 18 days with no sun at all. The bulk of the dull days came throughout the third week of the month. Sunniest day was the 30th with 5.1 hours.
So was January an anomaly or are we going to see more chilly weather in February? Check with us next month to find out!
| Measure | Unit | Minimum | Average | Maximum | Average min | Average max | Total |
|---|---|---|---|---|---|---|---|
| Relative humidity | % | 56 | 87 | 96 | |||
| Temperature | °C | -4.6 | 3.6 | 11.7 | 1.1 | 6.3 | |
| Wind source (most common/highest gust) | Sector | N | S | ||||
| Wind speed | mph | 2.7 | 37 | 15.6 | |||
| Rain daily accumulation | mm | 2.3 | 25.4 | 71.6 | |||
| Barometric pressure | hPa | 970.6 | 1012.3 | 1040.8 | |||
| Solar irradiance during daylight | W/m² kWh/m² | 69 | 390 | 199 | 18.3 |
||
| Sunshine (according to University of California formula) | Hours | 1.1 | 5.1 | 33.5 |
Want to get email notification of weather news? Sign up here
Here is a list of Weather News articles.
- Nearly back to normal – a summary of the weather of October 2026
- 37 months and counting – a review of the weather of September 2026
- A long hot dry summer – a review of the weather of Meteorological Summer 2026
- The heat and drought go on – a summary of the weather of August 2026
- An astonishing month of heat and drought records – a summary of the weather of July 2026
- Temperature records broken for the second month in a row – a review of the weather of June 2026
- We need your photos!
- Warmest Spring on record
- Heat records smashed – a summary of the weather of May 2026
- More records tumble, some not even in April – a review of the weather of April 2026
- Turned out nice again – a review of the weather of March 2026
- That’s why they call it February fill-dyke – a review of the weather of February 2026
- A wet start to the year – a review of the weather of January 2026
- It keeps getting warmer – a summary of the weather of 2025
- More records broken – a review of the weather of December 2025
- A month of ups and downs – a review of the weather of November 2025
- Bookended by storms – a review of the weather of October 2025
- At last a normal month – a review of the weather of September 2025
- Two storms and a heatwave – a summary of the weather of August 2025
- A third heatwave but some rain at last – a review of the weather of July 2025
- More heat records – a review of the weather of June 2025
- May rounds off a warm, dry Spring – a review of the weather of May 2025
- Wall to wall sunshine (almost) – a review of the weather of April 2025
- Lambs all the way – a review of the weather of March 2025
- A quiet February – a review of the weather of February 2025
- Cold snaps and storms – a review of the weather of January 2025
- It’s still getting warmer – a review of the year’s weather in 2024
- It was a grey Christmas – a review of the weather of December 2024
- A first taste of Winter – a summary of the weather of November 2024
- And still it’s mild – a review of the weather of October 2024
- Still wet and still warm (just) – a review of the weather of September 2024
- A proper month of Summer – a review of the weather of August 2024
- Summer returns! A review of the weather of July 2024
- At last it’s stopped raining! – a review of the weather of June 2024
- Clear evidence of climate warming – a summary of the weather of May 2024
- So was it a cold April? A review of the weather of April 2024
- And still it’s mild and wet… a review of the weather of March 2024
- Records tumble as it stays wet and mild – a review of the weather of February 2024
- Storms and ice – a review of the weather of January 2024
- Another warmer and wetter year – a review of the year’s weather in 2023
- A soggy end to a soggy year – a review of the weather of December 2023
- The wet Autumn continues – a review of the weather of November 2023
- Storm Babet lets us off lightly – a review of the weather of October 2023
- Records tumble in sultry September – a review of the weather of September 2023
- A thoroughly average August – a review of the weather of August 2023
- Wet and cool – or was it? A review of the weather of July 2023
- Flaming June – more records go – a review of the weather of June 2023
- Plenty of settled weather – a review of May 2023
- An unremarkable month – a review of the weather of April 2023
- Squelching into Spring – a review of the weather in March 2023
- Dry February – a review of the weather of February 2023
- A month of split personality – a review of the weather of January 2023
- Another record-breaking year – a review of the weather of 2022
- Three seasons in a month – a review of the weather of December 2022
- Snow report
- Wet and mild – a review of November 2022
- At last we’re back!
- Back to (almost) normal – a review of the weather of September 2022
- More crazy record-breaking weather!
- Records tumble as desert like conditions prevail – a review of July 2022
- Heatwave newsflash – new record temperature for Epping
- The warm and dry theme continues – a review of June 2022
- The dry spell continues – a review of May 2022
- April Showers dry up again – a review of April 2022
- More like a lamb than a lion – a review of March 2022
- A notably stormy month – a review of February 2022
- A year of calm – a review of the weather of 2021
- The New Year slips quietly in – a review of January 2022
- Fifty shades of grey – a review of December 2021
- Autumn quietly peters out – a review of November 2021
- Still warm and wet as the evenings draw in
- An afterglow of Summer
- Autumn comes early
- And another wet month!
- June 2021 was a month of two halves
- Our weather is still lurching between extremes!
- April Showers dry up
- Some Mad March Days but also record temperatures
- Winter and Spring in a couple of weeks
- The north wind doth blow, and we shall have snow
- A review of the weather in Epping in 2020
- Wet and gloomy sums it up
- A mild but otherwise average November
- Wet wet wet – weather review of October 2020
- Another heat record broken in September
- August had some of everything except snow
- A traditional English summer
- Not much Blazing in changeable June
- Wall to wall sunshine for lockdown May
- It’s April, so where are the showers?
- March comes in like a lion, goes out like a lamb
- February Fill-dyke
- The warmest January in Epping records!