

Weather news
At last it’s stopped raining!
A review of the weather of June 2024
After nine consecutive months in which both temperature and rainfall were above the long term average, would June be the tenth?
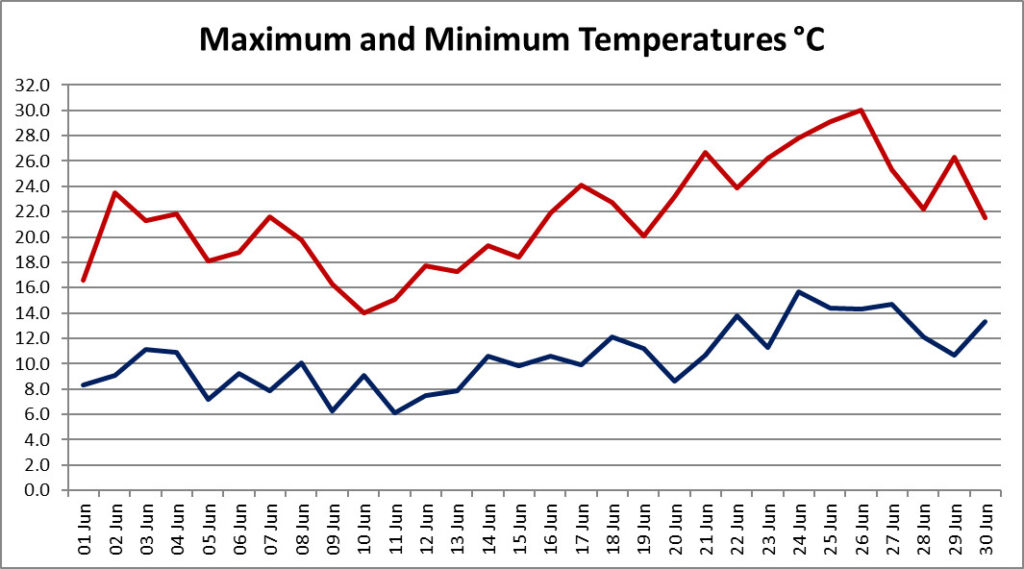
Well, it may surprise you to learn that although it felt like an often cool month, the temperature was indeed above average. The overall monthly mean was 16.0°C, which although the coolest of the last five years is still above the long term average mean of 15.2°C. Our warmest day was 26th, with 30.0°C, the average daily maximum was 21.7°C, and the lowest day maximum on 10th was just 14.0°C – all three of these figures were above the long term averages. The coolest temperature recorded this month was in the early hours of the 11th, at 6.1°C, which is spot on the long term average. The last month now that had a mean temperature below the long term average was August 2023 – and that only by 0.1°C.
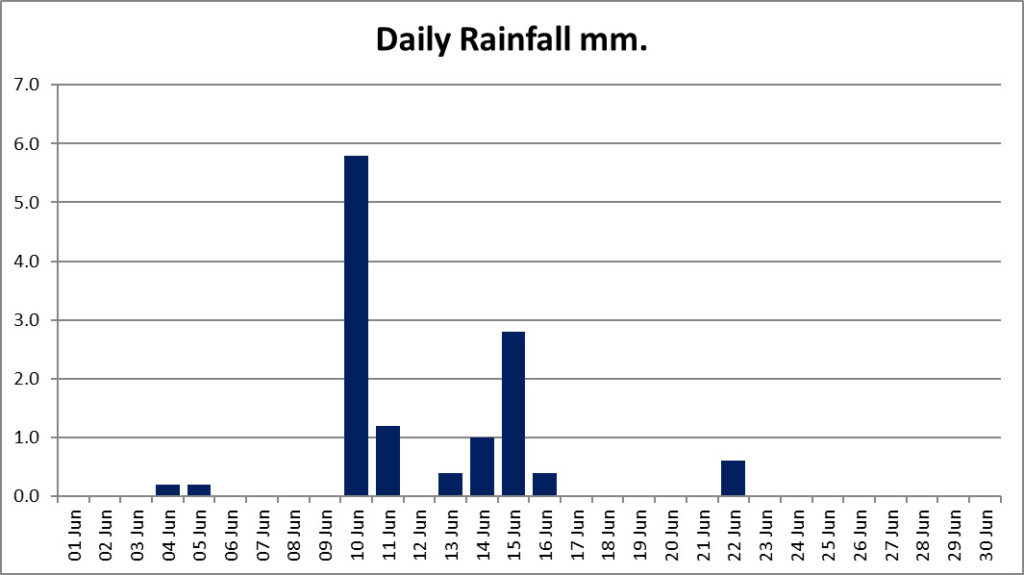
However, for the first month of the past ten, June was actually drier than average. In fact, it was the third driest in our 40 years of records, with 12.6 mm compared with the average of 56.5 mm. There were just nine days on which it rained, the wettest being the 10th with 5.8 mm; there have been only two Junes in our records with a wettest day that delivered less rain.
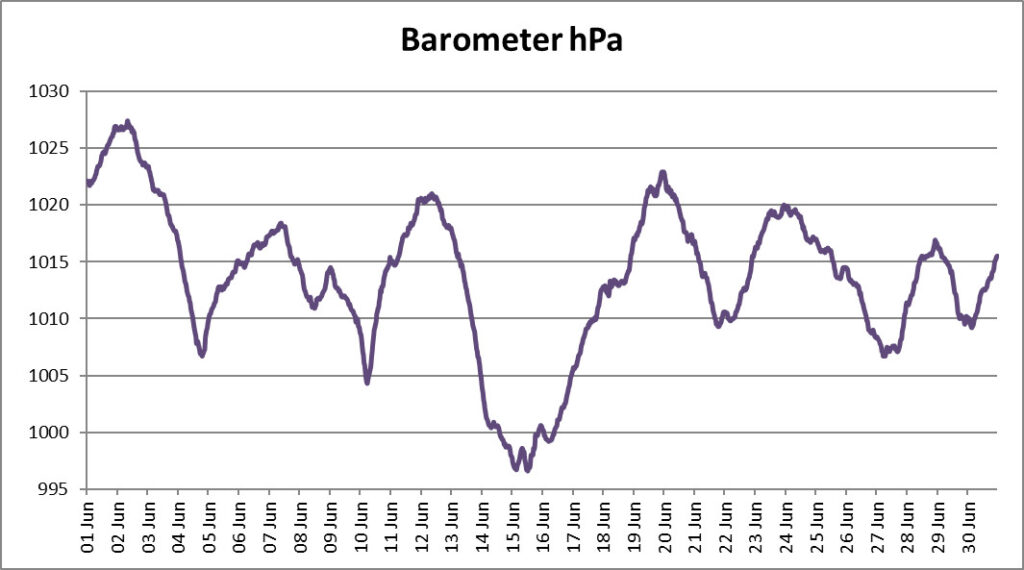
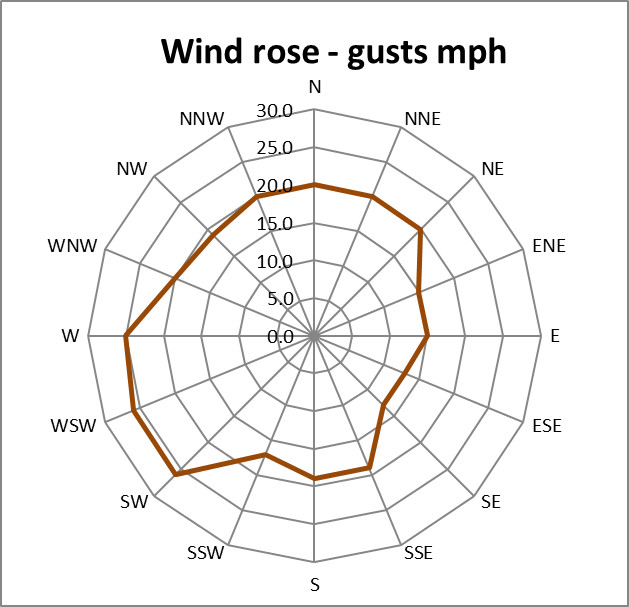
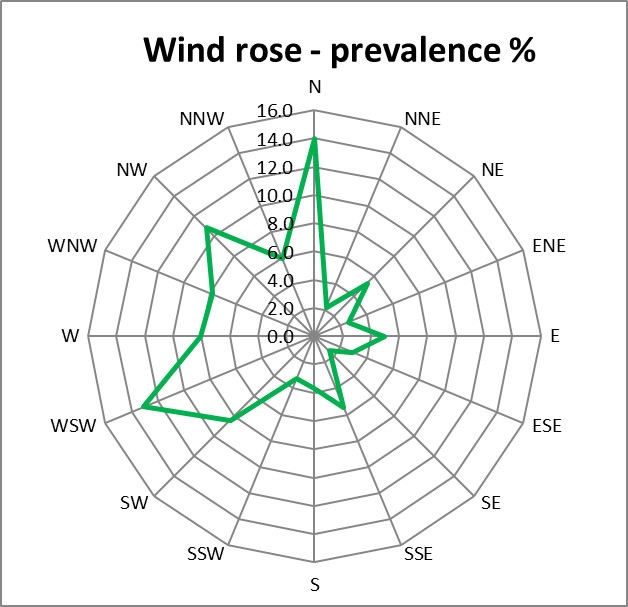
The winds for the month were a little on the breezy side but not exceptional; the maximum gust was of 26 mph (Force 6) from the SW on 16th. The commonest (‘mode’) wind direction for the month was northerly, but the main sector from which the wind blew was north-west to south-west.
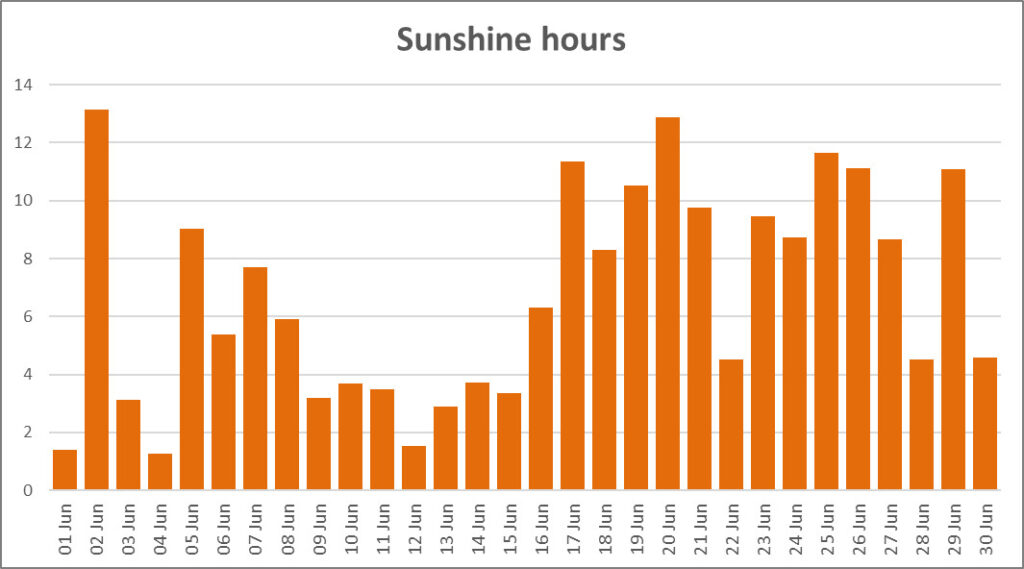
This month we’ve updated our Sunshine analysis. The weather station includes a pyrometer which measures the power of the light radiation falling on its sensor, giving us a value in watts per square metre. We had been reporting how this translates into sunshine according to the Met Office view that a value of greater than 120 watts per square metre represents sunshine , hence a lower figure means cloud. This has clearly been misrepresenting the actuality, and in fact the Met Office figure is only valid for a sensor pointing directly at the sun, rather than a fixed horizontal sensor such as the one we use.
We have now found a very complex calculation developed by the University of California which enables us to translate our reading into sunshine based on many factors, including the date and the latitude and altitude of the sensor, and thanks to the power of Excel we now have a more realistic measure of hours of sunshine per day to present. It’s too complex to put online, but we can include it in the monthly summaries. If you are interested, the details and the calculation spreadsheet are on their website here.
So for June, we can report that there were a total of 202.3 hours of sunshine, an average of 6.7 hours a day. We don’t have any history to compare with, but the Met Office mean for East Anglia covering 1991-2020 is 195.8 hours, so this suggests that our June was just slightly above average. There was some sunshine recorded on every day in June. The sunniest day was the 2nd, with 13.1 hours. The 21st was of course our longest day, when there was 16 hours 40 minutes between sunrise and sunset, but on that day we recorded 9.7 hours.
| Measure | Unit | Minimum | Average | Maximum | Average min | Average max | Total |
|---|---|---|---|---|---|---|---|
| Relative humidity | % | 37 | 70 | 92 | |||
| Temperature | °C | 6.1 | 16.0 | 30 | 10.5 | 21.7 | |
| Wind source (most common/highest gust) | Sector | N | SW | ||||
| Wind speed | mph | 2.3 | 26 | 15.1 | |||
| Rain daily accumulation | mm | 0.4 | 5.8 | 12.6 | |||
| Barometric pressure | hPa | 996.6 | 1013.5 | 1027.4 | |||
| Solar irradiance during daylight | W/m² kWh/m2 | 311 | 1297 | 1005 | 157.6 | ||
| Sunshine (according to University of California formula) | Hours | 6.7 | 13.1 | 202.3 |
Want to get email notification of weather news? Sign up here
Here is a list of Weather News articles.
- Temperature records broken for the second month in a row – a review of the weather of June 2026
- We need your photos!
- Warmest Spring on record
- Heat records smashed – a summary of the weather of May 2026
- More records tumble, some not even in April – a review of the weather of April 2026
- Turned out nice again – a review of the weather of March 2026
- That’s why they call it February fill-dyke – a review of the weather of February 2026
- A wet start to the year – a review of the weather of January 2026
- It keeps getting warmer – a summary of the weather of 2025
- More records broken – a review of the weather of December 2025
- A month of ups and downs – a review of the weather of November 2025
- Bookended by storms – a review of the weather of October 2025
- At last a normal month – a review of the weather of September 2025
- Two storms and a heatwave – a summary of the weather of August 2025
- A third heatwave but some rain at last – a review of the weather of July 2025
- More heat records – a review of the weather of June 2025
- May rounds off a warm, dry Spring – a review of the weather of May 2025
- Wall to wall sunshine (almost) – a review of the weather of April 2025
- Lambs all the way – a review of the weather of March 2025
- A quiet February – a review of the weather of February 2025
- Cold snaps and storms – a review of the weather of January 2025
- It’s still getting warmer – a review of the year’s weather in 2024
- It was a grey Christmas – a review of the weather of December 2024
- A first taste of Winter – a summary of the weather of November 2024
- And still it’s mild – a review of the weather of October 2024
- Still wet and still warm (just) – a review of the weather of September 2024
- A proper month of Summer – a review of the weather of August 2024
- Summer returns! A review of the weather of July 2024
- At last it’s stopped raining! – a review of the weather of June 2024
- Clear evidence of climate warming – a summary of the weather of May 2024
- So was it a cold April? A review of the weather of April 2024
- And still it’s mild and wet… a review of the weather of March 2024
- Records tumble as it stays wet and mild – a review of the weather of February 2024
- Storms and ice – a review of the weather of January 2024
- Another warmer and wetter year – a review of the year’s weather in 2023
- A soggy end to a soggy year – a review of the weather of December 2023
- The wet Autumn continues – a review of the weather of November 2023
- Storm Babet lets us off lightly – a review of the weather of October 2023
- Records tumble in sultry September – a review of the weather of September 2023
- A thoroughly average August – a review of the weather of August 2023
- Wet and cool – or was it? A review of the weather of July 2023
- Flaming June – more records go – a review of the weather of June 2023
- Plenty of settled weather – a review of May 2023
- An unremarkable month – a review of the weather of April 2023
- Squelching into Spring – a review of the weather in March 2023
- Dry February – a review of the weather of February 2023
- A month of split personality – a review of the weather of January 2023
- Another record-breaking year – a review of the weather of 2022
- Three seasons in a month – a review of the weather of December 2022
- Snow report
- Wet and mild – a review of November 2022
- At last we’re back!
- Back to (almost) normal – a review of the weather of September 2022
- More crazy record-breaking weather!
- Records tumble as desert like conditions prevail – a review of July 2022
- Heatwave newsflash – new record temperature for Epping
- The warm and dry theme continues – a review of June 2022
- The dry spell continues – a review of May 2022
- April Showers dry up again – a review of April 2022
- More like a lamb than a lion – a review of March 2022
- A notably stormy month – a review of February 2022
- A year of calm – a review of the weather of 2021
- The New Year slips quietly in – a review of January 2022
- Fifty shades of grey – a review of December 2021
- Autumn quietly peters out – a review of November 2021
- Still warm and wet as the evenings draw in
- An afterglow of Summer
- Autumn comes early
- And another wet month!
- June 2021 was a month of two halves
- Our weather is still lurching between extremes!
- April Showers dry up
- Some Mad March Days but also record temperatures
- Winter and Spring in a couple of weeks
- The north wind doth blow, and we shall have snow
- A review of the weather in Epping in 2020
- Wet and gloomy sums it up
- A mild but otherwise average November
- Wet wet wet – weather review of October 2020
- Another heat record broken in September
- August had some of everything except snow
- A traditional English summer
- Not much Blazing in changeable June
- Wall to wall sunshine for lockdown May
- It’s April, so where are the showers?
- March comes in like a lion, goes out like a lamb
- February Fill-dyke
- The warmest January in Epping records!